A heatmap is a powerful way to visualise data. Given a matrix of data each value is represented by a color. The implementation of the heatmap algorithm is expensive in computation terms: for each grid’s pixel you need to compute its colour from a set of known values. As you can thing, it is not feasible to be implement it on the client side because map rendering would be really slow.
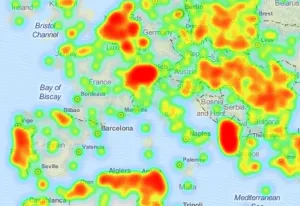
But OpenLayers3 comes with a handy class, ol.layer.Heatmap, which allows to render vector data as a heatmap, so the question is: how it is made?
Really, the ol.layer.Heatmap layer uses a smart approximation to the algorithm which produces great results and is really fast. The steps can be summarised as:
- A gradient of colors is created as a 1x256 pixel size image.
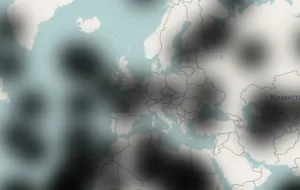
- Each known value is rendered in a canvas as a grey blurred point using some radius. This produces a canvas where the blurred points can overlap each other and create more obscure zones. Something similar to this.
- Finally, an image is obtained from the canvas and for each pixels a color is assigned. The color is obtained from the previous 1x256 pixel image obtained the color specified by the grey value (which goes from 0..255).
The coloured image is then rendered in the map canvas, obtaining a nice effect suited to be used for density maps. The ol.layer.Heatmap offers some properties we can use to play better: blur, radius, gradient, shadow and weight. This last can be configured per feature, allowing to assign a level of importance to each feature determining in more or less measure the final color.