Pyramid tiles are used by many providers as a more efficient way (than WMS server) to provide images. The idea is simple, we have zoom levels and on every level we have NxN tiles of a specific size (typically 256x256 pixels). Google, Yahoo, Bing or OpenStreetMaps are samples of tile providers.
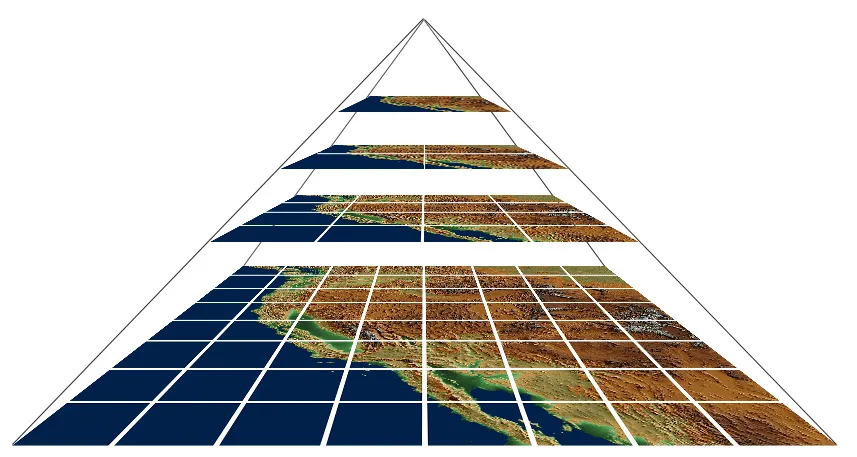
Here, we are going to create a new OpenLayers layer that will show a checkboard with the name of the tile, all this with the help of the Google Charts API.
We need to take into account every provider uses a different pyramid tile notation, that means the same tile can be named [level=1,x=0,y=0] by one provider and named [level=1,x=0,y=1] by another.
Next code is based on OpenLayers.TMS layer, which follow the OSGeo TMS specification.
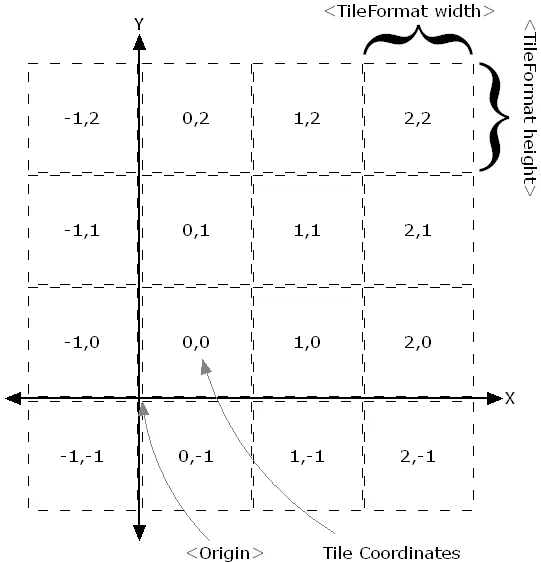
I have divided the code in two TMS subclasses. The first one is responsible to draw the checkboard and the second one to draw the tile name on top every tile. The checkboard layer makes use of Google Chart API to generate black tiles.
OpenLayers.Layer.Checkboard = OpenLayers.Class(OpenLayers.Layer.TMS, {
  getURL: function (bounds) {
    var res = this.map.getResolution();
    var z = this.map.getZoom();
    var limit = Math.pow(2, z);
    var x = Math.round(
      (bounds.left - this.maxExtent.left) / (res * this.tileSize.w)
    );
    var y = Math.round(
      (this.maxExtent.top - bounds.top) / (res * this.tileSize.h)
    );

    if (y < 0 || y >= limit) {
      return "";
    } else {
      x = ((x % limit) + limit) % limit;
      var tilename = "";
      if ((x + y) % 2 == 0) {
        tilename =
          "http://chart.apis.google.com/chart?chst=d_text_outline&;chs=256x256&chf=bg,s,ffffffff&chld=FFFFFF|12|h|000000|b||";
      } else {
        // no tile
      }
      return tilename;
    }
  },

  CLASS_NAME: "OpenLayers.Layer.Checkboard",
});
Next is the code that return the tile names:
OpenLayers.Layer.Tilenames = OpenLayers.Class(OpenLayers.Layer.TMS, {
  getURL: function (bounds) {
    var res = this.map.getResolution();
    var z = this.map.getZoom();
    var limit = Math.pow(2, z);
    var x = Math.round(
      (bounds.left - this.maxExtent.left) / (res * this.tileSize.w)
    );
    var y = Math.round(
      (this.maxExtent.top - bounds.top) / (res * this.tileSize.h)
    );

    if (y < 0 || y >= limit) {
      return "";
    } else {
      x = ((x % limit) + limit) % limit;

      var tilename = "";
      if ((x + y) % 2 == 0) {
        tilename =
          "http://chart.apis.google.com/chart?chst=d_text_outline&;chs=256x256&chld=FFFFFF|12|h|000000|b||";
      } else {
        tilename =
          "http://chart.apis.google.com/chart?chst=d_text_outline&;chs=256x256&chld=000000|12|h|FFFFFF|b||";
      }
      tilename = tilename + "(" + z + "/" + x + "/" + y + ")";
      return tilename;
    }
  },

  CLASS_NAME: "OpenLayers.Layer.Tilenames",
});