Some month ago I found nice post on how to create heatmaps using HTML5 canvas element. Its author, Patrick Wied, created a nice JavaScript code responsible to create a heatmap over an image depending on the mouse click or mouse move events.
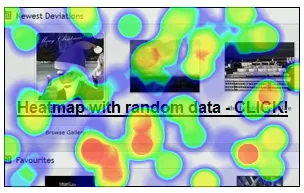
Instantly, I though to take a look and try to create an OpenLayers heatmap layer. Unfortunately I was very busy and have no time to work on. But… fortunately the project author has enough time to continue improving it and he has created the desired heatmap OpenLayers layer (and also one more for Google Maps), which you can test here and looks like:
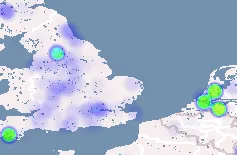
The big issue at this moment is the heatmap isn’t a layer by itself and it needs a reference to a “real” layer (like a WMS layer) to render it. If we look at code we need three things:
- Some data for the hetmap.
var testData={
	max: 46,
	data: [{lat: 33.5363, lon:-117.044, count: 1}, ... ,{lat: 35.8278, lon:-78.6421, count: 1}]
};- A “real” OpenLayers layer.
layer = new OpenLayers.Layer.MapServer(
  "OpenLayers WMS",
  "http://labs.metacarta.com/wms/vmap0",
  { layers: "basic" }
);- Create the heatmap layer based on previous data and layer.
heatmap = new OpenLayers.Layer.Heatmap(
  "Heatmap Layer",
  map,
  layer,
  { visible: true, radius: 10 },
  { isBaseLayer: false, opacity: 0.3 }
);
heatmap.setDataSet(testData);
map.addLayers([layer, heatmap]);
Although it is not perfect really it is a great job. Thanks Patrick.